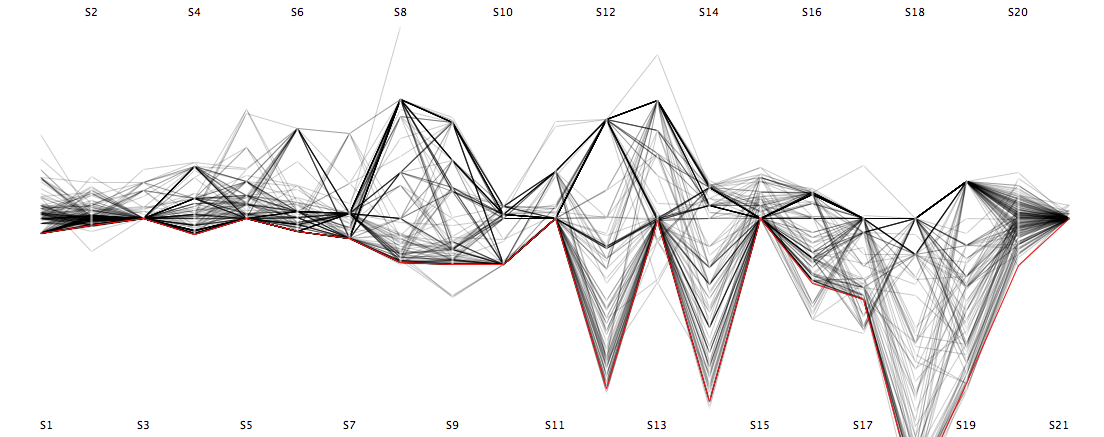
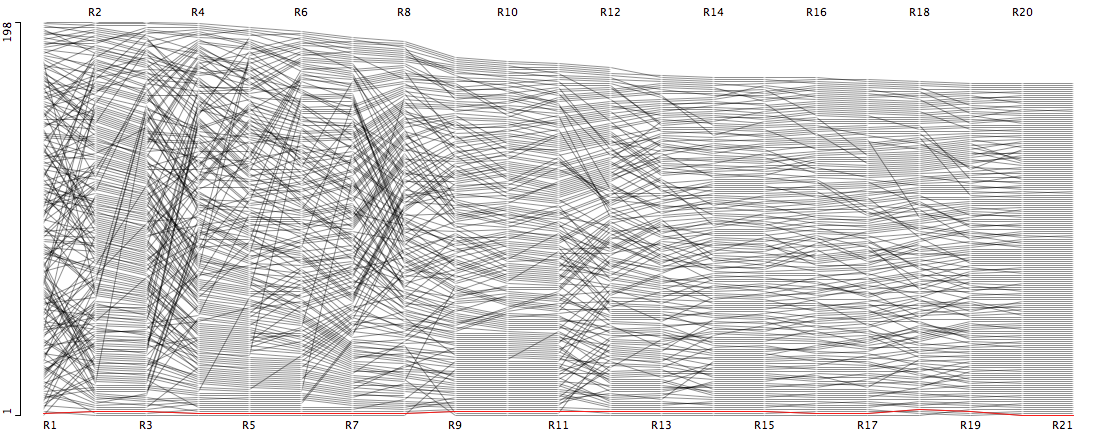
Tour de France 2011
— that’s it for this year, see you in 2012 (the latest) – au revoir! —
(With now 7 years of full Tour de France data, I might start to compare the different tours on a more “global” level.)
Again, the Tour de France has to compete with the soccer world championship – ok, this time it’s the girl’s turn and the attention is somewhat smaller …
Although I “missed” the first 5 stages, I will start to log the results in the usual ways as in 2005, 2006, 2007, 2008, 2009 and 2010.
STAGE 6: Still a very compact group of 18 riders at the top of the field
STAGE 7: Easy riding
STAGE 8: The first mountains shrink the top group to 11
STAGE 9: Thomas VÖKLER now almost 2′ ahead
STAGE 10: No changes in the Top 42
STAGE 11: Still waiting for the Pyrenees
STAGE 12: Team Leopard-Trek lead by the SCHLECK brothers with 5 in the top 44
STAGE 13: Vincent JEROME lost hist last place for the first time
STAGE 14: Thomas VÖCKLER still almost 2” in front
STATE 15: Here are the 28 drop-outs so far, as the ranks almost stay unchanged
STAGE 16: HUSHOVD wins and TEAM GARMIN takes the lead
STAGE 17: The worse riders are all collected into the peloton
STAGE 18: Andy SCHLECK rushes (almost) to the top! Still 4 within 1′ reach!
STAGE 19: VOECKLER can’t defeat the SCHLECK brothers but still in reach
STAGE 20: EVANS too fast for Andy Schleck but not for MARTIN
STAGE 21: Congratulations to Cadel EVANS
(Note: The official results for stage 2 are missing, and thus are calculated from the differences of the total times)
For those who want to play with the data. The graphs are created with Mondrian.
There is a more elaborate analysis of Tour de France (2005) data in the book.
Of course – as every year – a big thanks to Sergej for updating the script!


