Flowing Data
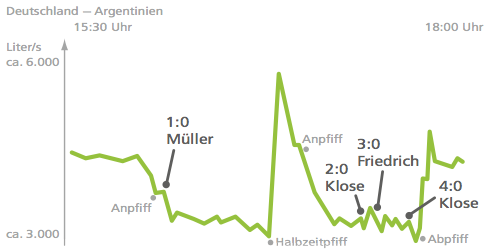
This graphics was in the current newsletter of the local utility company, and shows the (estimated) water consumption during the quarter final of the soccer world cup between Germany and Argentina.

I think there is no need to translate the annotations, and everybody might guess what the beer drinking people of Germany did during the break.
Just wondering how a different outcome would have impacted the flow of water …


