German Election 2013: 3. Structural Considerations
The german reunification is now on its way for almost a quarter of a century. One might think that by now, it might be hard to find the artificial division as a result from WWII, as structural features resulting from centuries of common history might be overruling what was a 40 year political intermezzo.
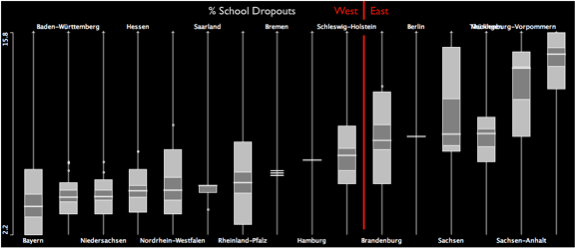
Not so, when you look at these graphs, based on the 2013 election results and the accompanying socio-economic data:
The boxplot shows the quota of people who did not get any school degree. Unfortunately, this measure still divides Germany into two parts.
Not having any school degree also is a good predictor for unemployment, which we can read from the following scatterplot on the left. A bit surprising is, that no matter how badly people are educated, at a certain point unemployment does hardly rise any further – as can be seen from the lowess smoother.
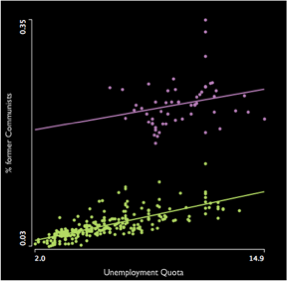
The right scatterplot shows the impact of the unemployment quota on the result of the former communist party (“Die Linke”). Again, we see a strict divide between east and west (even within Berlin). The interesting thing though (which is almost certainly by chance) is the fact, that for each % unemployment, the communists gain 0.5% of votes – no matter wether you are in the west or east. The funny thing is that this party claims full employment, organized by the state, which would make them the worst voting result (using this model 🙂 ).
Stay tuned for the next post, which will show how the small people of the Swabians killed the party leaders of FDP and Greens …


