Thinking Statistics – Visually
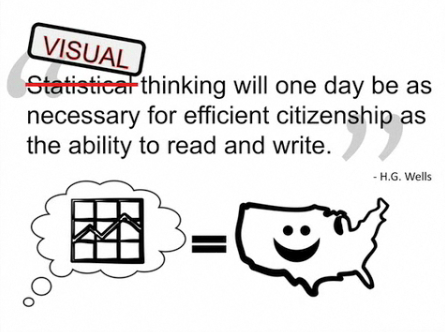
I found this on the infoaesthetics blog. There is one slide in the presentation that made me think:

I got the impression that this quote from Herbert George Wells – more known for his science fiction literature – suffers badly when modified this way.
Statistical thinking – from my point of view – means the ability to understand figures (as in numbers) in a way that utilizes meaningful summaries and graphs, and can somehow distinguish between a signal and noise. I doubt that there is something like “visual thinking”. Rather there is statistical thinking (or more generally speaking analytical thinking) which utilizes graphical representations of the data in order to more easily summarize the essential information.
What Alex Lundry probably wanted to exchange in this slide was the presentation of statistical information in tables with the presentation of this information in graphs.


