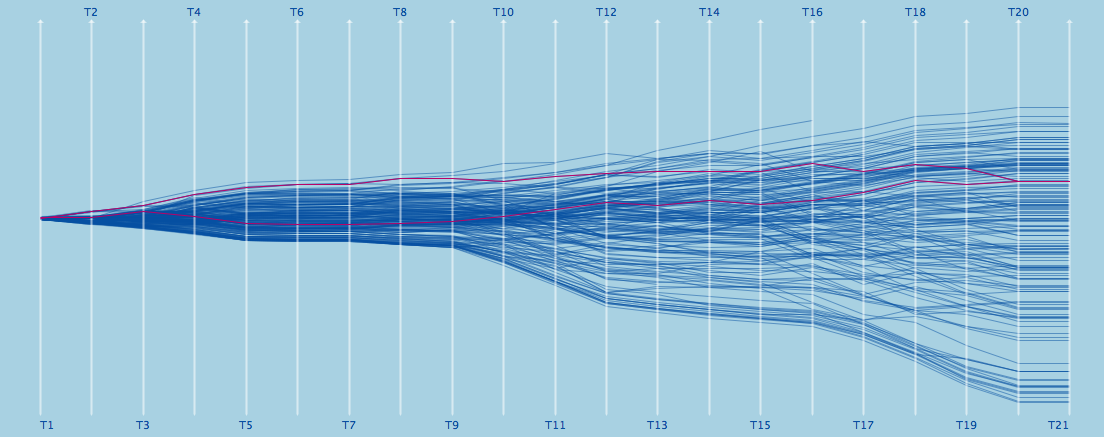
Tour de France 2015
I made sort of an early start this year and have the data for the second stage already sorted out. I will start to log the results in the usual way as in 2005, 2006, 2007, 2008, 2009, 2010, 2011, 2012, 2013 and 2014 now:
STAGE 2: MARTIN still at the front while ROHAN fell back
STAGE 3: FROOME now at the top, CANCELLARA out after mass collision
STAGE 4: 7 drop outs after 4 stages, more to come …
STAGE 5: top 19 now consistent within roughly 2 minutes
STAGE 6: MARTIN drops out as a crash consequence
STAGE 7: 12 drop outs by now, and the mountains still to come
STAGE 8: SAGAN probably has the strongest team (at least so far …)
STAGE 9: Some mix up in the top 16, but none to fall back
STAGE 10: The mountains change everything, FROOME leads by 3′ now
STAGE 11: BUCHMANN out of nowhere
STAGE 12: No change in the top 6, CONTADOR 4’04” behind
STAGE 13: BENNETT to hold the Lanterne Rouge now
STAGE 14: Is team MOVISTAR strong enough to stop FROOME?
STAGE 15: Top 6 within 5′ – the Alpes will shape the winner
STAGE 16: A group of 23 broke out, but no threat for the classement
STAGE 17: GESCHKE wins and CONTADOR looses further ground
STAGE 18: A gap of more than 20′ after the first 15 riders now
STAGE 19: QUINTANA gains 30” on FROOME
STAGE 20: QUINTANA closes the gap to 1’12”, but not close enough
STAGE 21: Au revoir, with a small “error” in the last stage 😉
Don’t miss the data and make sure to watch Antony’s video on how to analyze the data interactively!


Hi Martin, great blog, thanks for sharing.
Where are you getting the TDF data from? Is it raw with potentially more info to be derived?
Guille
Interesting graphs. Where are you sourcing your data from? What program are you using for graph production?
The data is crawled from the official Tour de France website at http://www.letour.fr/ using an R script with htmlTreeParse at its heart. There is actually not more data on the site to use. Getting intermediate standings of a stage is probably quite tricky as this would need some real time processing.
The graphs are all made with Mondrian (http://www.theusRus.de/Mondrian).
Hi,
I am in a class doing some statistical analysis (Graduate Program at UW) I know that the tour isn’t finished yet, but wondering if you will be updating the data set with stage 20 as well as the time trial after tomorrow’s race.
I was also able to find your dataset from 2010 – 2015, but wondering if there is a chance the 2005 – 2009 data is available online or if you can email it??
Thank you,
AE
Hi Martin,
I am also in a graduate class (Information Visualization) at the University of Oregon and wanted to say I appreciate your work compiling this data for analysis!
I did find a potential issue with the 2015 rider data crawled from the LeTour site — the winner, Chris Froome, was born in 1985, not 1977. It’s a small thing, but I wanted to alert you.
Thanks,
Steve